April 2026
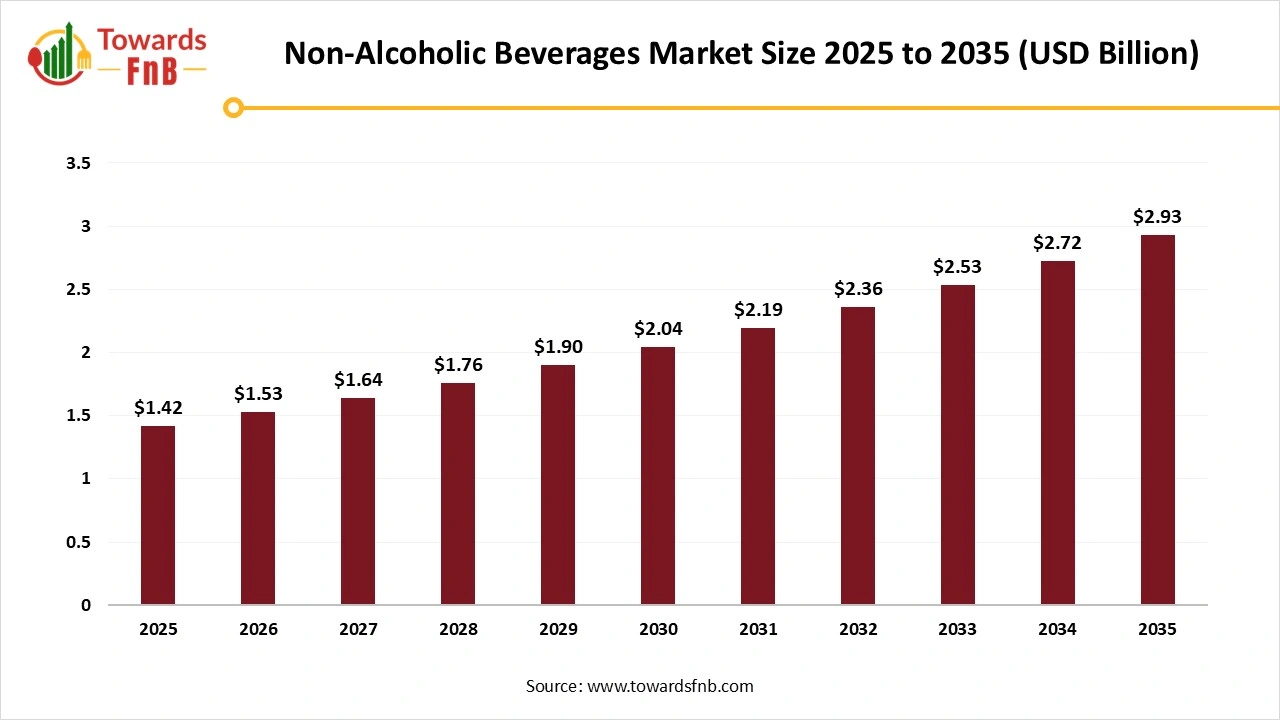
The global non-alcoholic beverages market size reached at USD 1.42 billion in 2025 and is anticipated to increase from USD 1.53 billion in 2026 to an estimated USD 2.93 billion by 2035, witnessing a CAGR of 7.5% during the forecast period from 2026 to 2035. The shift of consumers towards healthier lifestyle, change in consumer preferences and innovation in products variety holds the significant share for growth of the market.

| Study Coverage | Details |
| Growth Rate from 2026 to 2035 | CAGR of 7.5% |
| Market Size in 2026 | USD 1.53 Billion |
| Market Size in 2027 | USD 1.64 Billion |
| Market Size by 2035 | USD 2.93 Billion |
| Largest Market | Asia Pacific |
| Base Year | 2025 |
| Forecast Period | 2026 to 2035 |
| Regions Covered | North America, Europe, Asia-Pacific, Latin America, and Middle East & Africa |
Non-alcoholic beverages are potable liquid which has either no ethyl alcohol or less than 0.5% of alcohol in it. These may include premium coffee, cold drinks, carbonated drinks, bottled water, juices, functional drinks which are enriched with vitamins and other nutrients.
With the growing acceptance of the of the non-alcoholic beverages globally the market has seen the rise and growth rapidly. The change in lifestyle and change in preferences of the consumers have led this market, the shift towards healthier options like low calorie, low sugar content drinks has helped this market to grow and strict regulations by food and beverage industrie on the quality of food also has attracted the customers.
The advanced technology and innovation in the brewing industry will be a revolution in the food and beverage industry, like online applications for customisation of the product to understand the new trends in the beverages and new and modified flavours. The introduction of flavour with the incorporation of technology, like adding a wide range of options within the application, will help gain the customer's attention toward the industry more. This will help the brand to reach more customers. Collaboration with the wellness sector will gain more attention of the health-conscious consumers, all these strategies will help the market to reach the target in the forecasted period.
The dominance of global giants such as Nestle, PepsiCo, and Coca-Cola makes the entry of small businesses challenging in the market at a larger level. Premium products such as premium drinks, and premium coffee limit the growth in the market due to high cost and price sensitivity as consumers look for pocket-friendly and affordable options. The growing economic regions and developing regions are more focused onto the continent and affordable price range as the middle-class population dominated in these countries.
In the non-alcoholic beverages industry, the raw material procurement deals with strategic procedure of purchasing, evaluating, processing, sourcing and packaging of clean-label and sustainable beverages from the various natural, plant-based, natural and clean-label beverage products.
Branding and Packaging for global non-alcoholic beverages market focuses on creating packaging which may ensures remain stable, safe and fresh by protecting them from contamination, light and moisture.
The waste management and recycling of non-alcoholic beverages focus on the health and wellness of consumers seeking low- or no-alcohol beverages into nutritious, valuable and new organic and clean label products or ingredients.
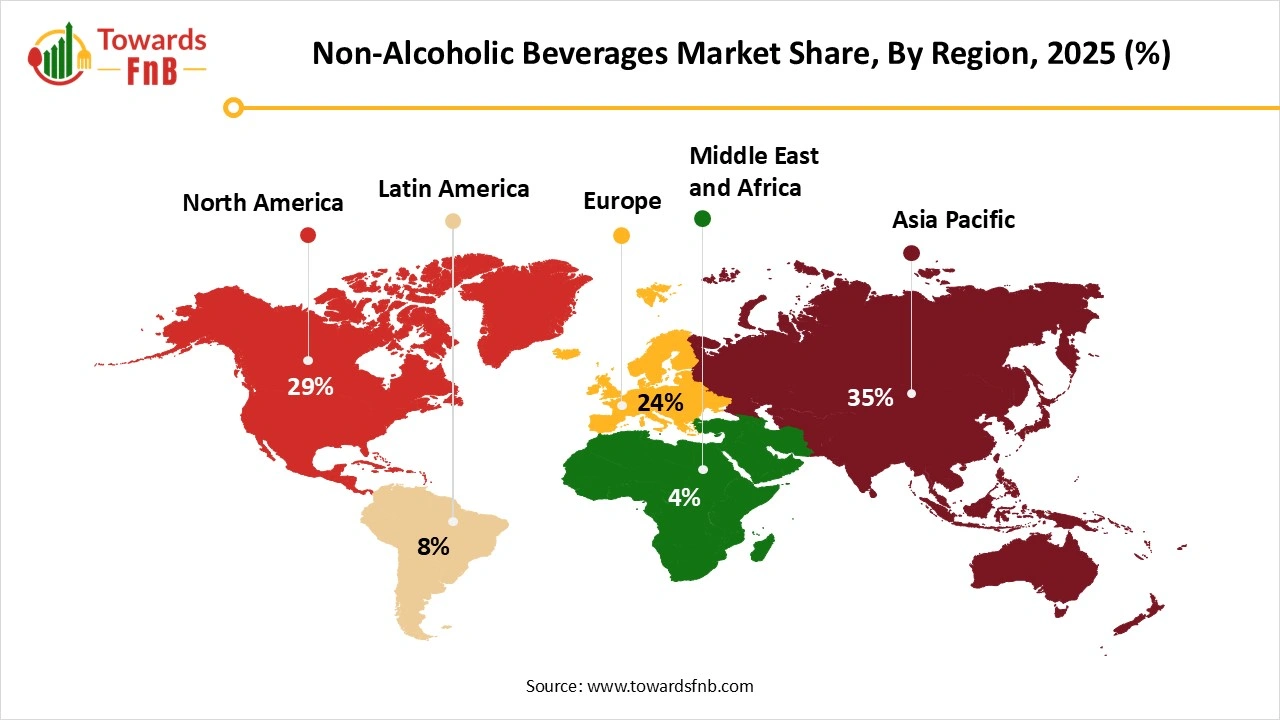
Asia Pacific Dominated the Non-Alcoholic Beverage Market in 2025
Increasing demand for non-alcoholic beverages from developing countries is expected to drive the market. The increasing disposal incomes and change in preferences and lifestyle changes, urbanization and adoption of Western culture have led to an increase in the consumption of packaged drinks and sports drink. The shift towards healthier functional beverages enriched with vitamins, probiotics and other nutrients has helped the market to grow.
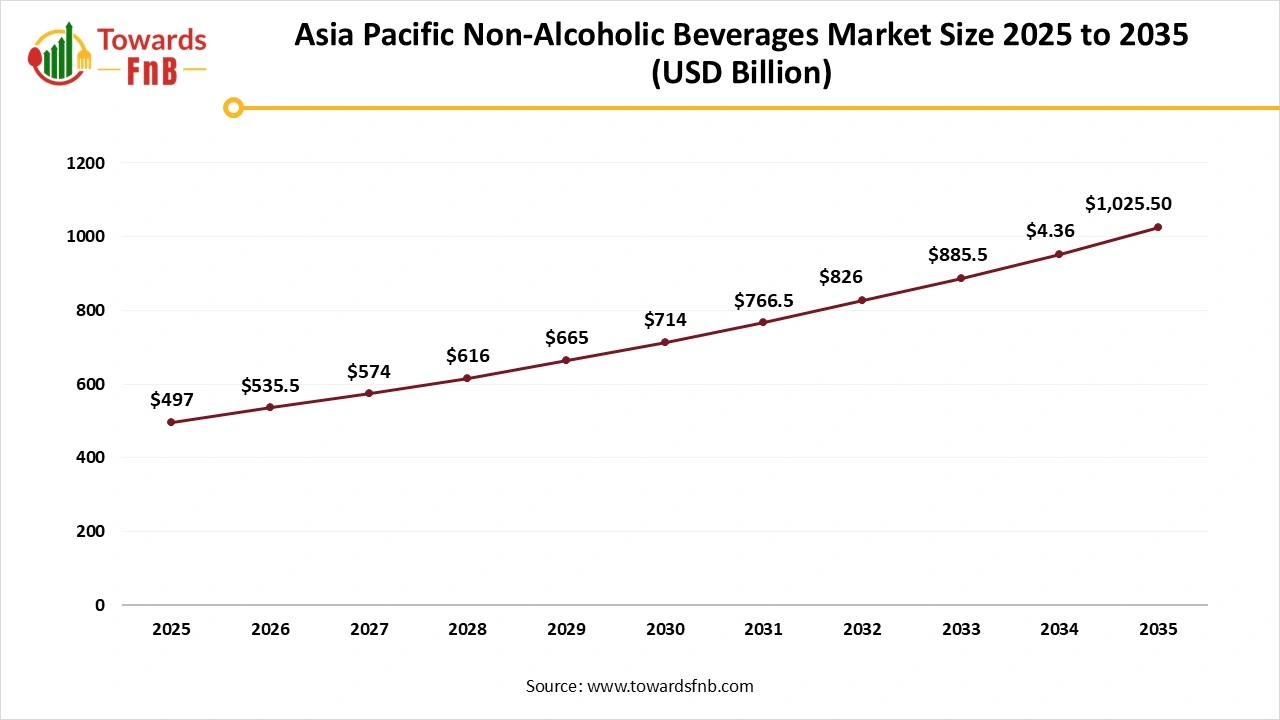
Asia Pacific Non-Alcoholic Beverage Market Size 2025 to 2035
The Asia Pacific non-alcoholic beverages market size reached at USD 497 billion in 2025 and is anticipated to increase from USD 535.5 billion in 2026 to an estimated USD 1,025.50 billion by 2035, witnessing a CAGR of 7.5% during the forecast period from 2026 to 2035.

India Non-alcoholic Beverages Market Trends
India’s non-alcoholic beverage market is expanding rapidly, driven by rising health awareness, urbanization, and diverse consumer preferences. Demand for juices, functional drinks, bottled water, and ready-to-drink teas is increasing. Brands focus on natural ingredients, low sugar, and innovative flavors, while modern retail and e-commerce boost accessibility and growth.
North American is Anticipated to Significant Growth in Non-Alcoholic Beverages Market in the Forecast Period
The demand for different variety of beverage options, including carbonated drinks, bottled water, energy drinks and juices has increased the demand for the market in this region. The increasing demand for health-conscious choices, such as sugar-free, organic, low-calorie beverages, indicated the shift towards healthier lifestyles and preferences.
United States Non-alcoholic Beverages Market Trends
The U.S. non-alcoholic beverage market is growing steadily, driven by demand for healthier, low-sugar options and functional drinks. Consumers increasingly choose flavored water, energy drinks, plant-based beverages, and ready-to-drink teas and coffees. Innovation, wellness trends, and strong retail distribution continue to shape the market’s expansion.
")
How is Europe Transforming the Non-alcoholic Beverages Market?
Europe is expected to grow at a notable rate during the forecast period. The market growth in the region is driven by factors such as increasing shift towards diverse and healthier options, growing beverage industry, increasing consumer demand for natural ingredients and sustainability, and increasing consumer health awareness.
Germany Non-alcoholic Beverages Market Trends
The global market in Germany is driven by the increasing consumer focus on health and wellness, rising innovation in beverage production, increasing demand for non-alcoholic options, and increasing consumer focus towards healthier lifestyles.
Why is the Middle East and Africa Driving the Non-alcoholic Beverages Market?
The market growth in the region is driven by factors such as the increasing demand for Halal-certified products, increasing consumer preferences towards product lines and flavors, growing global population, demand for convenience and ready-to-drink beverages and growing consumer awareness of health issues.
South Africa Non-alcoholic Beverages Market Trends
The market growth in the country is driven by increasing product innovation and health awareness, a rise in craft and specialty drinks, and increasing demand for no- and low-sugar options.
How is Latin America Driving the Non-alcoholic Beverages Market in 2024?
The Latin America non-alcoholic beverages industry is driven by increasing sustainability and health awareness, increasing demand for functional, low-sugar and natural drinks, rising innovation in sustainable packaging, and increasing consumer health awareness. Brazil and Mexico are the major countries driving the market growth.
Mexico Non-alcoholic Beverages Market Trends
The non-alcoholic beverages industry in Mexico is witnessing major growth, driven by increasing consumer preference towards sustainable drinks, expansion of beverage industry and increasing health awareness.
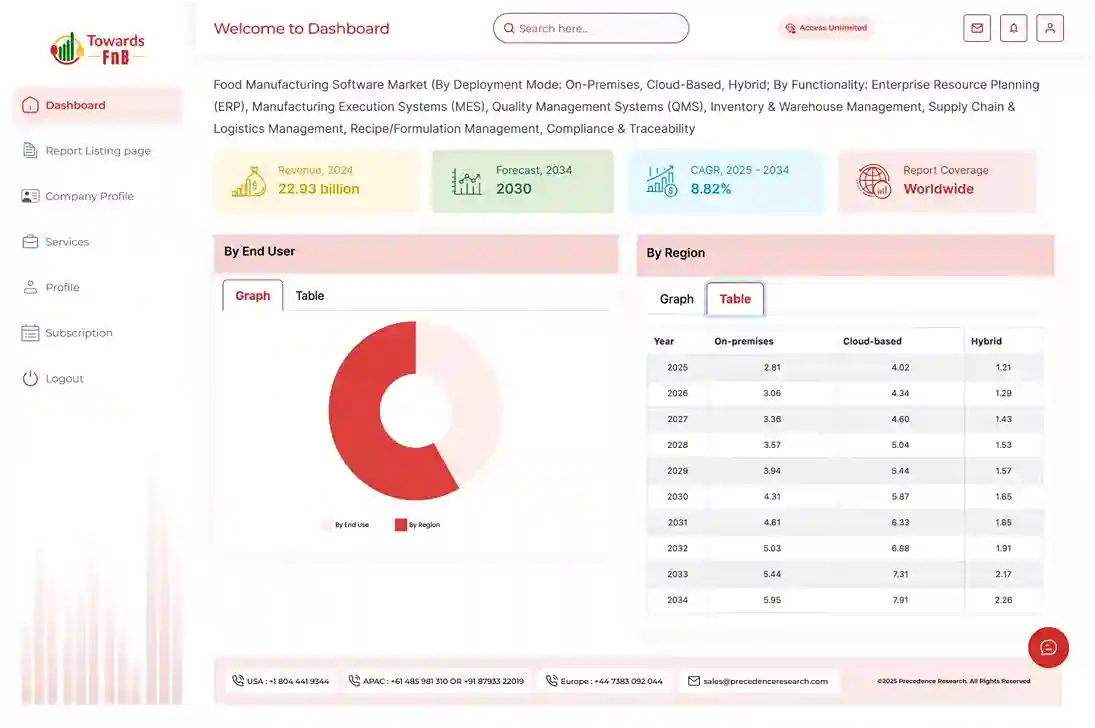
Non-Alcoholic Beverages Market Size By Region, 2024 to 2034 (USD Billion)
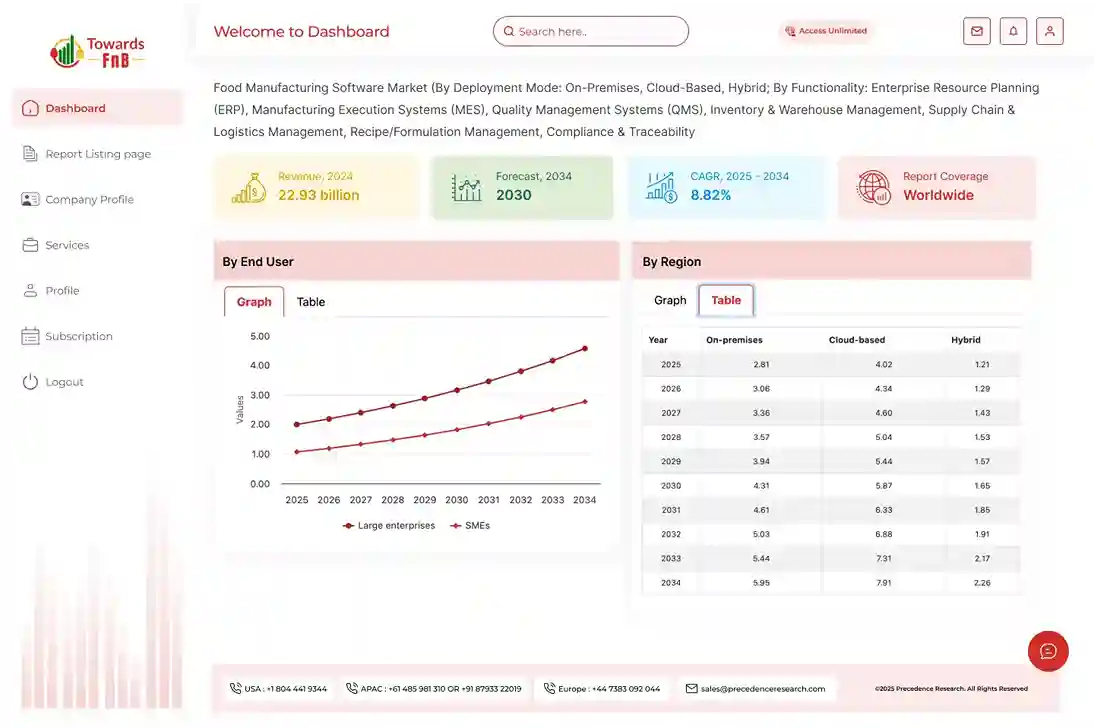
| By Region | 2024 | 2025 | 2026 | 2027 | 2028 | 2029 | 2030 | 2031 | 2032 | 2033 | 2034 |
| North America | 353.16 | 378.24 | 405.1 | 433.85 | 464.65 | 497.62 | 532.92 | 570.72 | 611.19 | 654.52 | 700.92 |
| Europe | 287.76 | 307.23 | 328.01 | 350.17 | 373.81 | 399.03 | 425.93 | 454.62 | 485.22 | 517.85 | 552.65 |
| Asia Pacific | 444.72 | 482.29 | 523 | 567.1 | 614.87 | 666.62 | 722.67 | 783.38 | 849.14 | 920.34 | 997.46 |
| Middle East and Africa | 91.56 | 96.6 | 101.88 | 107.41 | 113.19 | 119.24 | 125.56 | 132.16 | 139.03 | 146.2 | 153.66 |
| Latin America | 130.8 | 141.73 | 153.57 | 166.39 | 180.27 | 195.29 | 211.55 | 229.16 | 248.21 | 268.83 | 291.15 |
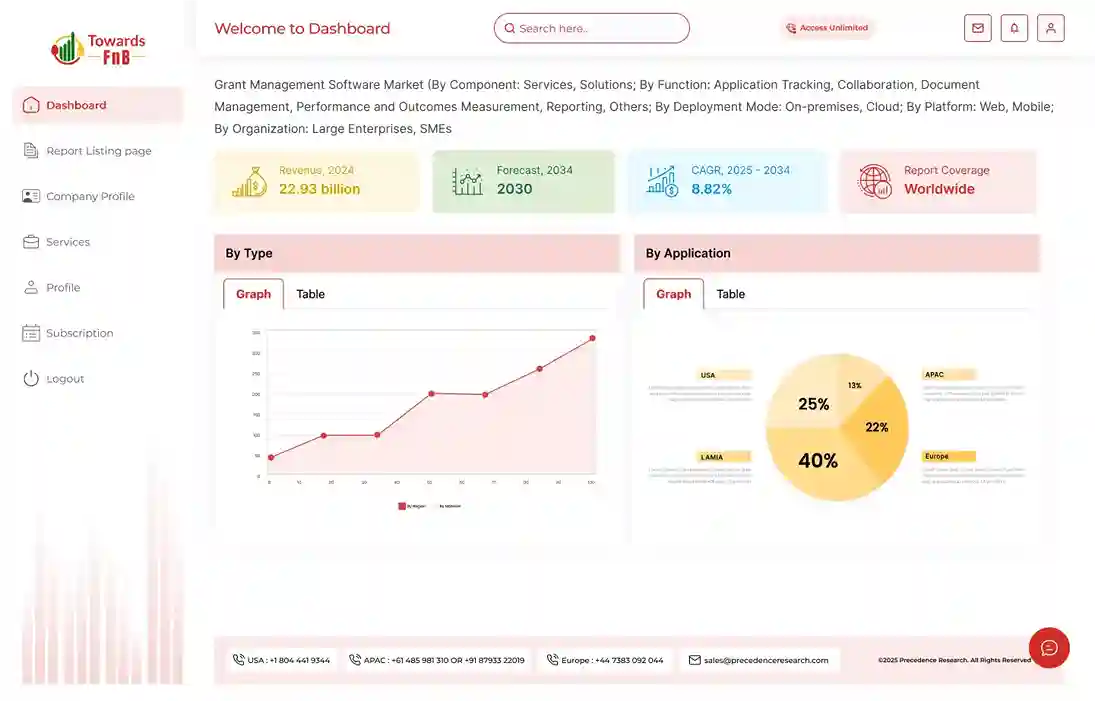
Non-Alcoholic Beverages Market Share, By Product, 2025 (%)
| Segments | Shares (%) |
| Carbonated Soft Drinks | 29% |
| Bottled Water | 21% |
| RTD Tea & Coffee | 14% |
| Functional Beverages | 12% |
| Juices | 11% |
| Dairy-based Beverages | 8% |
| Others | 5% |
The Carbonated Soft Drinks Segment Dominated the Non-Alcoholic Beverages Market in 2024.
Carbonated soft drinks are popular because of the variety of products available in different flavours and at affordable price ranges. It is also the most convenient and quick-access drink for every age group of consumers. The functional beverage segment is anticipated to grow significantly in market during forecast period. The increasing awareness about health-conscious consumers drives the market to grow.
Non-Alcoholic Beverages Market Size By Product, 2024 to 2034 (USD Billion)
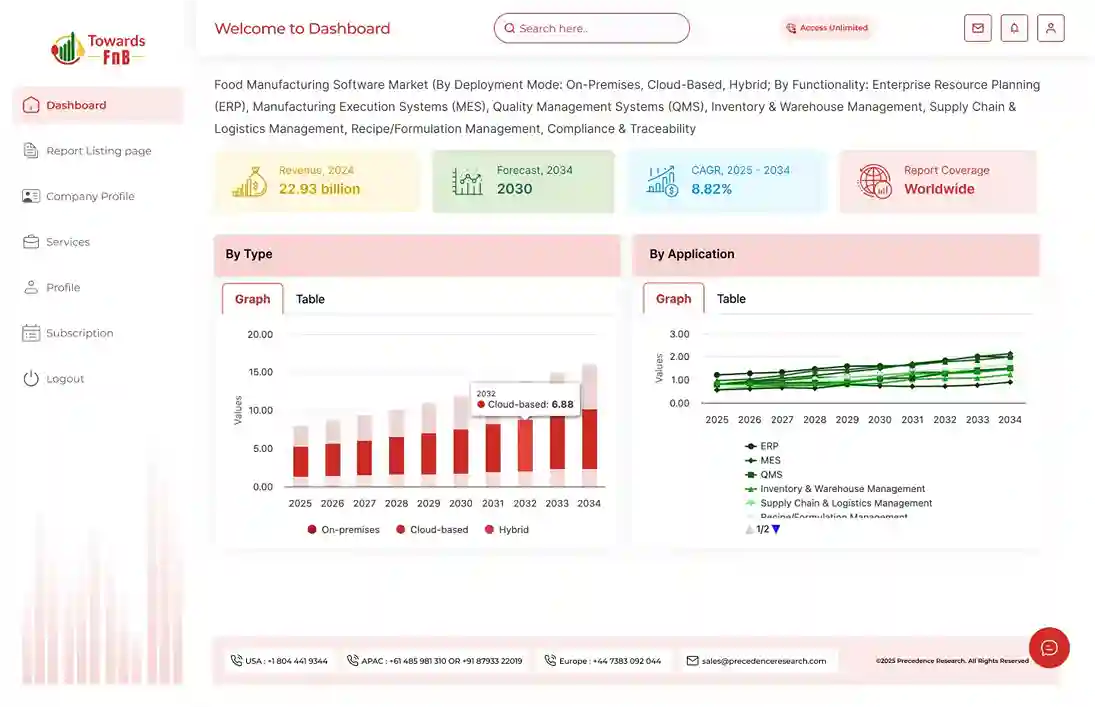
| By Product | 2024 | 2025 | 2026 | 2027 | 2028 | 2029 | 2030 | 2031 | 2032 | 2033 | 2034 |
| Carbonated Soft Drinks | 392.4 | 417.61 | 444.4 | 472.85 | 503.08 | 535.17 | 569.26 | 605.44 | 643.85 | 684.62 | 727.87 |
| Bottled Water | 313.92 | 339.57 | 367.31 | 397.29 | 429.71 | 464.76 | 502.64 | 543.59 | 587.86 | 635.71 | 687.44 |
| RTD Tea & Coffee | 130.8 | 142.72 | 155.69 | 169.8 | 185.16 | 201.86 | 220.03 | 239.79 | 261.27 | 284.63 | 310.02 |
| Functional Beverages | 156.96 | 171.54 | 187.43 | 204.74 | 223.59 | 244.11 | 266.46 | 290.78 | 317.26 | 346.07 | 377.42 |
| Juices | 156.96 | 167.33 | 178.36 | 190.12 | 202.63 | 215.95 | 230.12 | 245.21 | 261.27 | 278.36 | 296.54 |
| Dairy-based Beverages | 104.64 | 111.78 | 119.41 | 127.56 | 136.25 | 145.53 | 155.44 | 166.01 | 177.29 | 189.33 | 202.19 |
| Others | 52.32 | 55.54 | 58.95 | 62.56 | 66.38 | 70.42 | 74.69 | 79.21 | 83.98 | 89.03 | 94.35 |
Non-Alcoholic Beverages Market Share, By Distribution Channel, 2025 (%)
| Segments | Shares (%) |
| Retail | 69% |
| Food Service | 31% |
The Retail Segment Dominated the Non-Alcoholic Beverages Market in 2024.
Supermarkets, hypermarkets and other retail channels make the availability and accessibility of products very easy and at the convenience of the consumers. A wide variety of products are available for the consumers for comparison of products of different plans. The food service segment is anticipated to grow in the forecast period. The busy lifestyle of working individuals compels them to dine out. The rising disposable income in the population and spending culture on lifestyle boosts the demand for the food service. Additionally, the rise in the hotel and restaurant business in the urban areas are driving the growth of the segment.
Non-Alcoholic Beverages Market Size By Distribution Channel, 2024 to 2034 (USD Billion)
| By Distribution Channel | 2024 | 2025 | 2026 | 2027 | 2028 | 2029 | 2030 | 2031 | 2032 | 2033 | 2034 |
| Food Service | 457.8 | 494.95 | 535.09 | 578.47 | 625.35 | 676.01 | 730.75 | 789.89 | 853.8 | 922.85 | 997.46 |
| Retail | 850.2 | 911.15 | 976.47 | 1046.45 | 1121.44 | 1201.79 | 1287.89 | 1380.14 | 1478.99 | 1584.9 | 1698.37 |

By Product Type
By Distribution Channel
By Region

Principal Consultant
Vidyesh Swar, Senior Research Analyst at Towards Food & Beverages, specializes in market research, focusing on supply-demand evaluation, pricing analysis, alternative proteins, plant-based foods, and sustainable food technologies within the industry.
Learn more about Vidyesh Swar
Reviewed By
Aditi Shivarkar, with 14+ years in Food and Beverages market research, specializes in food, beverage, and eco-friendly packaging. She ensures accurate, actionable insights, driving Towards FnB's excellence in industry trends and sustainability.
Learn more about Aditi ShivarkarApril 2026
April 2026
April 2026
April 2026
Non-Alcoholic Beverages Market