March 2026
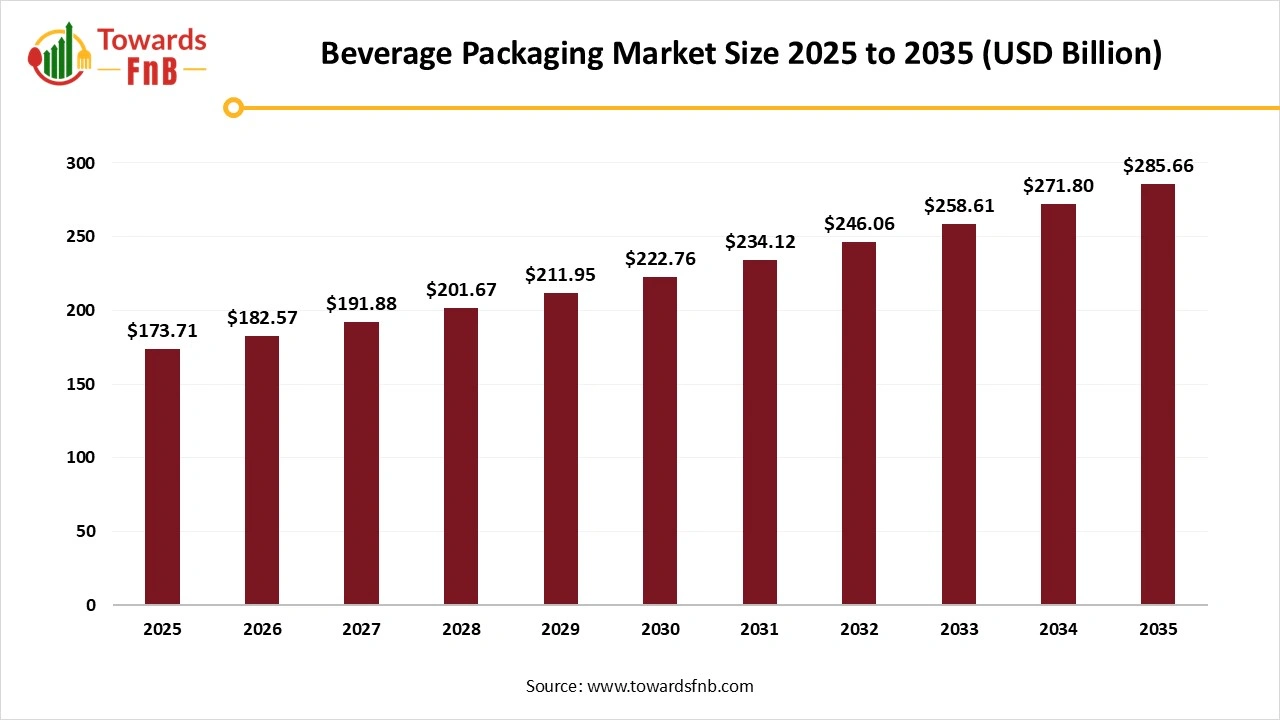
The global beverage packaging market size was valued at USD 173.71 billion in 2025 and is expected to grow steadily from USD 182.57 billion in 2026 to reach nearly USD 285.66 billion by 2035, with a CAGR of 5.1% during the forecast period from 2026 to 2035. The growing demand for eco-friendly products and environmental awareness, along with the rising need for convenient packaging expanding the market.

| Study Coverage | Details |
| Growth Rate from 2026 to 2035 | CAGR of 5.1% |
| Market Size in 2026 | USD 182.57 Billion |
| Market Size in 2027 | USD 191.88 Billion |
| Market Size by 2035 | USD 285.66 Billion |
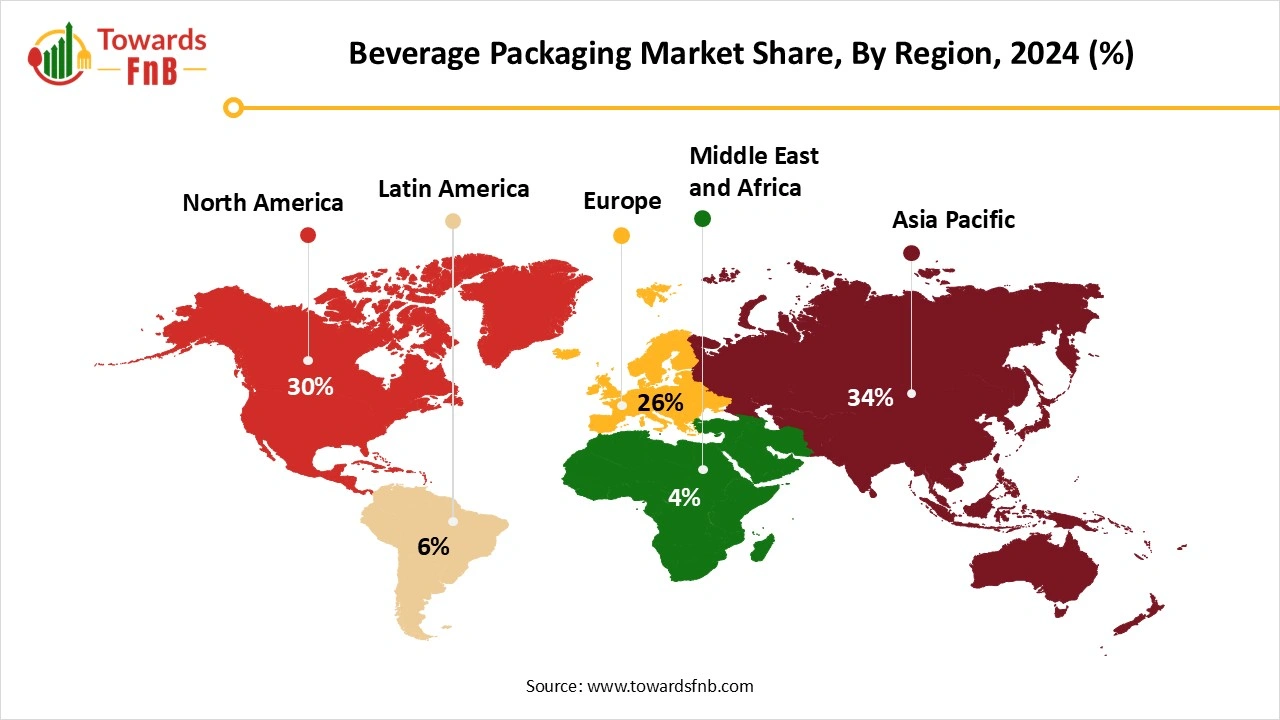
| Largest Market | Asia Pacific |
| Base Year | 2025 |
| Forecast Period | 2026 to 2035 |
| Regions Covered | North America, Europe, Asia-Pacific, Latin America, and Middle East & Africa |
The rise in hectic routines, the need for grab-and-go drinks is increasing. Ready-to-drink beverages also need easy and transportable packaging options. City residents are progressively seeking beverages that are convenient to drink while commuting, exercising, or engaging in other activities on the move. This has led to the creation of smaller, resealable, and lighter packaging designs. The growing population and higher net income in emerging markets are opening new opportunities for packaged drinks.
The worldwide market is experiencing significant demand from both alcoholic and non-alcoholic beverage sectors in developing economies. The entire market is experiencing growth due to an increase in the demand for functional beverages. Worldwide consumption of alcoholic beverages is primarily fueled by rising alcohol intake alongside a growing desire for premium products. These factors are majorly contributing for beverage packaging market.
Shelf appeal and aesthetics are the key elements in the worldwide beverage packaging industry, as they significantly influence purchasing choice of consumers. The most favored packaging types are those that convey brand identity or imply quality and freshness, with buying behavior often taking center stage. With significant attraction in aesthetically pleasing items, beverage brands have embraced creativity to set their products apart from others. This aspect raises the need for personalized packaging options to improve product visibility, enhance brand awareness and subsequently drive sales in a competitive marketplace.
| Scheme | Overview |
| Food Safety and Standards (Packaging) Regulations, 2018 | Since July 2025, the Food Safety and Standards Authority of India (FSSAI) has launched a guideline under Food Safety and Standards (Packaging) Regulations, 2028, for mandating at least 30% recycled PET (r-PET) utilization in new manufactured PET bottles of food and beverage packaging. (Source: RACE ecochain) |
| Extended Producer Responsibility (EPR) Scheme | The UK government launched the Extended Producer Responsibility (EPR) scheme, mandating that packaging producers have full financial responsibility for the collection, recycling, and disposal of their products. The scheme will come in act form October 2025. (Source: INside Packaging) |
The growing consciousness regarding environmental safety among consumers and the heightened acceptance of eco-friendly items create significant opportunities for manufacturers of beverage packaging products. A study by the National Retail Federation found that 69% of North American participants are willing to pay more for recycled products, and 80% want to understand the source of the products they purchase.
The primary challenge in the beverage packaging market is the availability and price variability of raw materials. Producers may struggle to maintain competitive pricing while managing quality and sustainability objectives. These variations compel companies to swiftly adjust, investing in substitute materials potentially hindering market growth and innovation.
Raw Material Procurement
Packaging and Branding
Waste Management and Recycling
Asia Pacific Led the Beverage Packaging Market in 2025
The Asia Pacific region boasts a large and swiftly expanding population in nations such as India and China. This extensive consumer market creates a strong need for drinks and, as a result, packaging for those drinks. Economic expansion in the Asia Pacific has resulted in higher disposable incomes, allowing consumers to invest more in packaged drinks. The Japan is chiefly influenced by the rising awareness of environmental issues and sustainability challenges that are affecting manufacturers in the country. Japanese beverage companies are utilizing packaging options derived from renewable resources.
The Asia Pacific beverage packaging market size was calculated at USD 59.06 billion in 2025 and is expected to grow from USD 62.07 billion in 2026 to reach nearly USD 97.12 billion by 2035, with a CAGR of 5.1% during the forecast period from 2026 to 2035.
The India Beverage Packaging Market Trends
India’s beverage packaging market is expanding rapidly due to rising consumption of bottled water, soft drinks, dairy beverages, and ready-to-drink products. Growth is driven by convenience demand, urbanization, and sustainability trends. PET bottles dominate, while paper cartons, glass, and metal cans gain traction as brands adopt eco-friendly and innovative packaging solutions.
North America is Expected to Grow at the Fastest Rate in the Market During the Forecast Period
The region has sophisticated manufacturing plants and technological advancements in packaging, resulting in the production of high-quality and sustainable beverage packaging. The stable economic climate in North America encourages ongoing consumer expenditures on various beverages, guaranteeing steady demand for beverage packaging.
The U.S. Beverage Packaging Market Trends
The U.S. expects the fastest growth during the predicted period. The market growth in the U.S. is driven by the increasing adoption of flexible and smart packaging solutions, increasing demand for energy and functional drinks and increasing consumer demand for sustainable and convenient options such as aluminum and plastic.
")
How is Europe Driving the Beverage Packaging Market?
Europe expects significant growth during the forecast period. The beverage packaging industry in Europe is attributed to rising technological advancement and efficiency, increasing consumer preference towards drinks such as juices probiotic drinks, sports drinks and energy drinks, and increasing consumer focus towards biodegradable, recyclable and sustainable materials. France, Germany and UK are the major economics fueling the market growth.
The UK Beverage Packaging Market Trends
The global market in UK is driven by the increasing demand for durable packaging, rise of e-commerce platforms, increasing consumer shift towards renewable and recyclable materials, and increasing consumer demand for sustainability and convenience, and includes paper, metal, plastic and glass packaging.
Why is the Middle East and Africa Revolutionizing the Beverage Packaging Market?
The beverage packaging industry in the region is driven by factors such as the growing young population, shifting consumer preferences, increasing disposable incomes, rising rapid urbanization, and increasing consumer demand for ready-to-drink beverages and convenience, resealable and lightweight beverage packaging.
South Africa Beverage Packaging Market Trends
The market growth in the country is growing at a healthy rate, driven by the increasing consumer focus on sustainability, expansion of e-commerce, rising beverage consumption, increasing demand for PET bottles for packaging and increasing consumer demand for ready-to-drink options and convenience.
Why is South America Fueling the Beverage Packaging Market in 2025?
The South America beverage packaging industry is driven by increasing demand for sustainable and flexible packaging such as paper-based options and pouches, increasing demand for alcoholic beverages and soft drinks.
Mexico Beverage Packaging Market Trends
The beverage packaging industry in Mexico is witnessing major growth, attributed by the increasing consumer shift toward eco-friendly and sustainable solutions, increasing demand for convenient packaging, high beverage consumption, increasing disposable incomes and urbanization.
Beverage Packaging Market Share, By Material, 2025 (%)
| Segments | Shares (%) |
| Plastic | 35% |
| Glass | 30% |
| Metal | 25% |
| Other Materials | 10% |
The Plastic Segment Dominated the Beverage Packaging Market in 2025
The plastic is lighter than materials like glass and metal. Plastic bottles and containers are simpler to transport and handle. These factors contribute to the rise in the market. Whereas the metal segment expects significant growth in the market during the forecast period. Metals are durable and highly resistant to strain and are also easy to transport. Aluminum cans have special appearance and contribute for brand recognition. These factors boost the market and raise the demand for metal cans.
Beverage Packaging Market Share, By Application, 2025 (%)
| Segments | Shares (%) |
| Alcoholic Beverages | 51% |
| Non-alcoholic Beverages | 49% |
The Alcoholic Beverages Segment Led the Beverage Packaging Market in 2025
The packaging significantly influences the perceived quality and branding of alcoholic beverages like beer, wine, and spirits. Further, non-alcoholic beverages are expected to grow at the fastest rate in the market during the forecast period. shoppers are progressively choosing functional beverages like energy drinks, sports drinks, and fortified waters that provide extra advantages driving the market.
Beverage Packaging Market Share, By Product, 2025 (%)
| Segments | Shares (%) |
| Bottle & Jar | 40% |
| Can | 25% |
| Pouch | 15% |
| Carton | 12% |
| Other Products | 8% |
The Bottle and Jar Segment Dominated the Market in 2025
Ready-to-drink beverages in bottles and jars provide convenience for consumption while traveling, attracting busy shoppers. Numerous bottled and jarred drinks are promoted as healthier choices, including natural juices, smoothie, and functional beverages, catering to consumer demand for healthier items. The carton product segment is expected to experience significant growth during the forecast period. Cartons are mainly produced from renewable resources like paperboard, which comes from wood pulp. This renders them more sustainable than plastic bottles or aluminum cans, attracting environmentally aware consumers and brands.

By Material
By Product
By Application
By Region

Principal Consultant
Vidyesh Swar, Senior Research Analyst at Towards Food & Beverages, specializes in market research, focusing on supply-demand evaluation, pricing analysis, alternative proteins, plant-based foods, and sustainable food technologies within the industry.
Learn more about Vidyesh Swar
Reviewed By
Aditi Shivarkar, with 14+ years in Food and Beverages market research, specializes in food, beverage, and eco-friendly packaging. She ensures accurate, actionable insights, driving Towards FnB's excellence in industry trends and sustainability.
Learn more about Aditi ShivarkarMarch 2026
March 2026
March 2026
March 2026
Beverage Packaging Market