April 2026
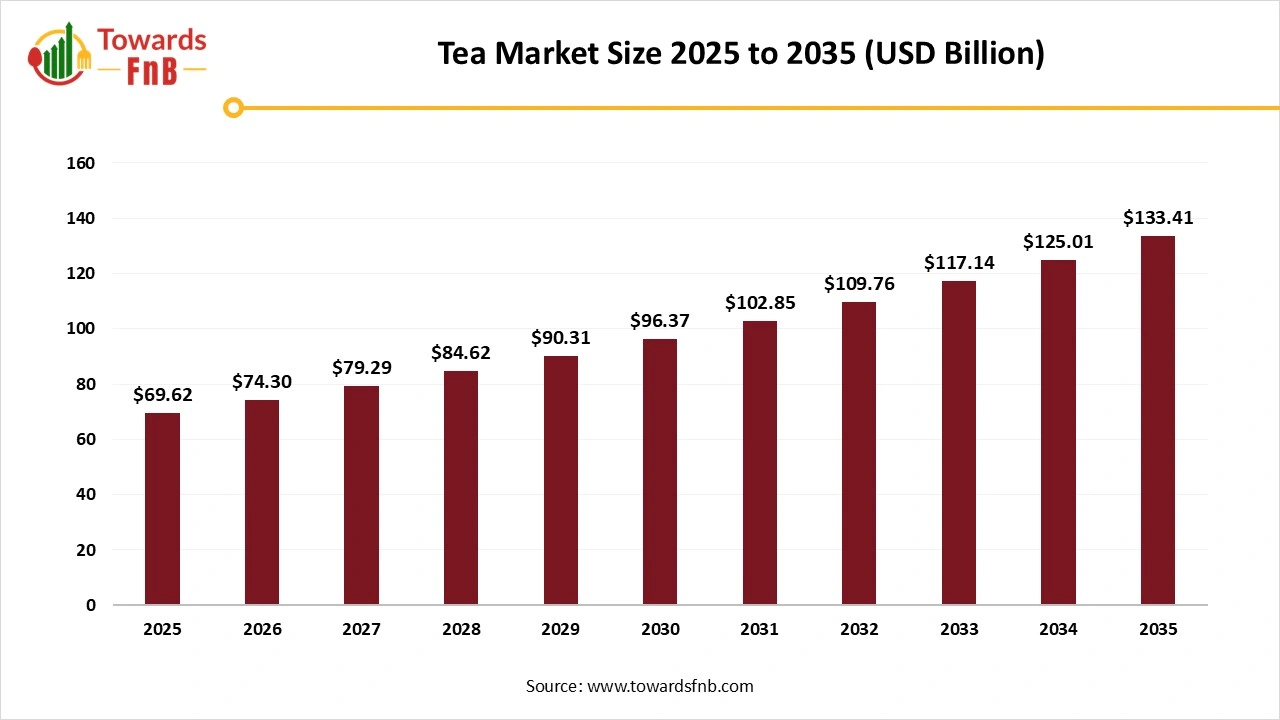
The global tea market size estimated at USD 69.62 billion in 2025 and is anticipated to increase from USD 74.30 billion in 2026 to an estimated USD 133.41 billion by 2035, witnessing a CAGR of 6.72% during the forecast period from 2026 and 2035. The market is driven by the increasing demand for teas with herbal blends and functional benefits which helps consumers to relief stress and support immunity.

| Study Coverage | Details |
| Growth Rate from 2026 and 2035 | CAGR of 6.72% |
| Market Size in 2026 | USD 74.30 Billion |
| Market Size in 2027 | USD 79.29 Billion |
| Market Size by 2035 | USD 133.41 Billion |
| Largest Market | Asia Pacific |
| Base Year | 2025 |
| Forecast Period | 2026 and 2035 |
| Regions Covered | North America, Europe, Asia-Pacific, Latin America, and Middle East & Africa |
The tea market is driven by the increasing consumer awareness towards health and wellness of tea benefits to promote relaxation and reduce inflammation. The market for tea also deals with tea products derived from Camellia sinensis leaves, including green, black, oolong, white, and herbal tea. It covers production, processing, packaging, and distribution across retail, food service, and online channels, driven by rising health awareness, flavored variants, specialty teas, and convenient ready-to-drink formats.
The market is also driven by various growth factors such as the increasing demand for alternatives to eco-friendly and natural products, increasing demand for organic tea, increasing rapid consumption of tea varieties, and increasing demand for premium and organic teas. In addition, increasing disposable incomes, growing e-commerce industry, increasing consumer preference towards tastes and flavors and rising popularity of herbal and flavored teas are further expected to drive the market growth during the forecast period.
The rise of technological advancements in the global market for tea is significantly focus on genomic tea breeding, non-thermal processing techniques, digitalization of farming and AI-driven harvesting. Computer vision and artificial intelligence allow high-precision and selective plucking, while sensors and drones digitize farming for efficient fertilization and irrigation, which may revolutionize the growth of the tea products.
In addition, advanced and new processing methods such as high pressure and ultrasound advanced genomic tools and improve extraction are being utilized to breed tea options with enhance sustainability, efficiency and quality and improved traits. AI-derived sensors and drones are used for irrigation and spraying and soil and moisture sensors provide valid data for digital maps, which further accelerates the demand for teas across the globe.
Raw Material Procurement
Packaging and Branding
Waste Management and Recycling
Tea Industry Regulatory Landscape: Global Regulations
| Country | Regulatory Body | Key Regulations | Focus Areas | Notable Notes |
| India | Food Safety and Standards Authority of India (FSSAI) | Food Safety and Standards (Packaging and Safety Regulations) and Licensing and Registration of Food Businesses) | Ingredients and additives: It focuses in to specify standards for several ingredients, such as milk products, green tea, and specialty and premium tea products. | Flavored Tea: Producers or manufacturers of flavored tea register with display the registration number on the label and Tea Board of India. |
Why Asia Pacific Dominates the Global Tea Market Revenue in 2025?
Asia Pacific dominated the global market revenue in 2025. The market growth in the region is attributed to the factors such as the rising expansion of online retail channels, increasing disposable incomes, increasing demand for functional and organic teas, increasing consumer health awareness, increasing demand for convenient tea products, changing consumer lifestyles and growing rapid urbanization.
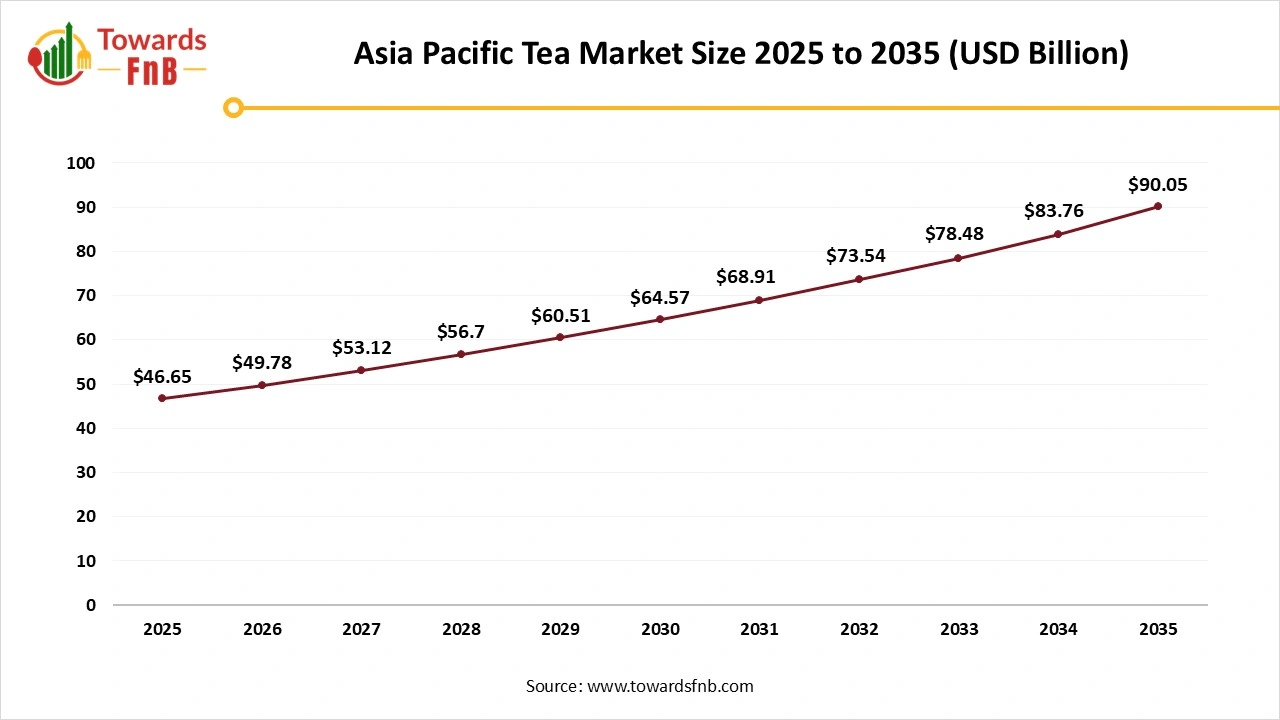
Asia Pacific Tea Market Size 2025 to 2035
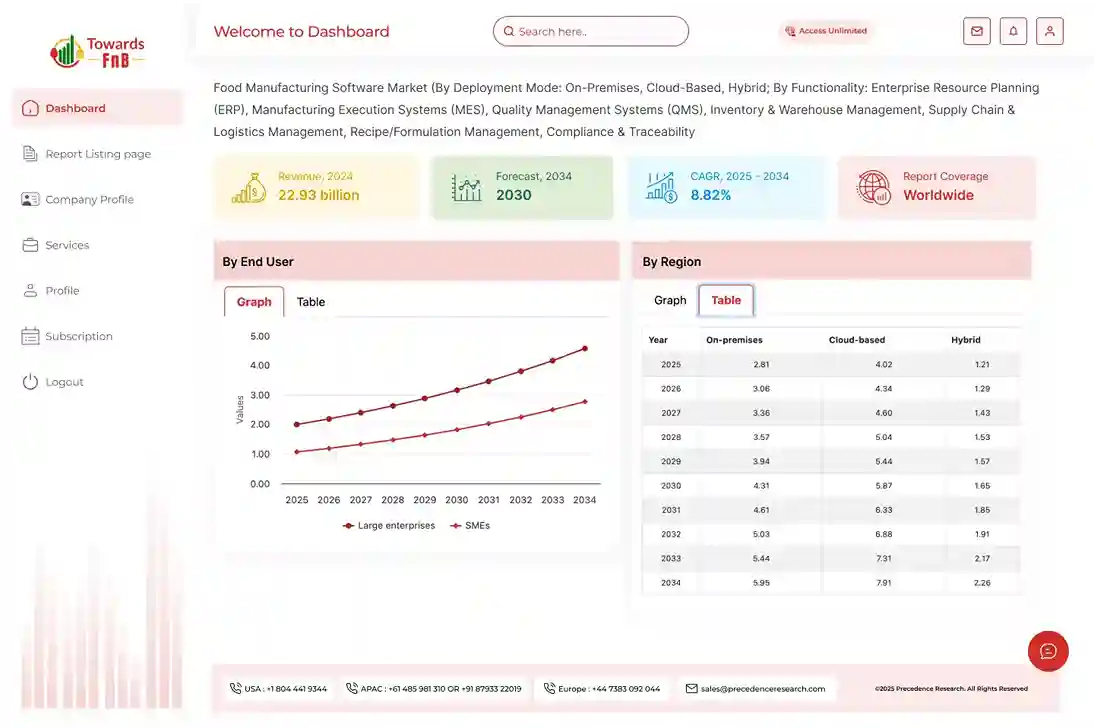
The Asia Pacific tea market size was calculated at USD 46.65 billion in 2025 with projections indicating a rise from USD 49.78 billion in 2026 to approximately USD 90.05 billion by 2035, expanding at a CAGR of 6.8% throughout the forecast period from 2026 to 2035.

India dominated the global tea market revenue in 2025. Indian tea exports hit a decade high of 255 million kg in 2025 and marked a 10% growth from 2023. Under the Indian brand, rising Kenyan tea imports, up 288%, spark concerns about blending. India sent 231.69 million kgs to the world markets, as compared to 2023. As compared to 1,374.97 million kg in 2023, India’s tea production stood at 1,382.03 million kgs in 2025.
North America Tea Market Trends
North America is expected to grow fastest during the forecast period. The market growth in the region is driven by factors such as the increasing consumer preference towards natural and organic products, increasing demand for ready-to-drink and convenient tea options, increasing consumer awareness towards health and wellness and rising innovation in exploration and packaging. The U.S. and Canada are the fastest growing countries fueling the market growth in North America.
Tea Market Share, By Product, 2025 (%)
| Segments | Shares (%) |
| Black Tea | 50% |
| Green Tea | 20% |
| Oolong Tea | 12% |
| White Tea | 6% |
| Herbal/Infusion Tea | 8% |
| Flavored & Specialty Tea | 4% |
How Black Tea Segment Dominates the Tea Market Revenue in 2025?
The black tea segment dominated the global market revenue in 2025. The segment growth in the global market is driven by its health benefits such support immune system, potential roles in weight management, enhanced mental health from caffeine, high antioxidant content and improved gut health and heart health. In addition, it also includes polyphenols such as the arubigins and the aflavins, help regulate blood pressure and cholesterol, promote healthy but bacteria and address oxidative inflammation and stress, which further expected to drive the segment growth in the global market.
The Herbal or Infusion Tea Segment is Expected to Grow Fastest During the Forecast Period
The segment growth in the market is driven by health benefits such as provide a healthy and flavorful way to stay hydrated, help prevent chronic diseases, help in the natural detoxification processes in the body, help to protect against infections, improve sleep quality, promote relaxation and reduce stress.
Tea Market Share, By Form, 2025 (%)
| Segments | Shares (%) |
| Loose Leaf Tea | 20% |
| Tea Bags/Pyramids | 40% |
| Ready-to-Drink (RTD) Tea | 25% |
| Instant Tea | 15% |
Why Tea Bags Segment Dominates the Tea Market Revenue in 2025?
The tea bags segment dominated the market revenue in 2025. Tea bags transformed tea consumption by offering unmatched portability and convenience for both cleanup and preparation, making tea easy and accessible to enjoy on the go or at home. Tea bags also have various non-beverage uses, such as serving as a first-aid bug bites, deodorizing spaces and reducing eye puffiness. In addition, Consuming true teas such as green and black tea can also offer major health benefits such as increased bone density, heart health benefits such as cholesterol, and improved brain function and support against certain cancers, which further expected to drive the market growth in the global market
The Ready-to-Eat (RTD) Tea Segment is Expected to Grow Fastest During the Forecast Period
Ready-to-drink teas boost of antioxidants for overall health and offer convenience, significantly enhancing immune function, improving bone mineral density and reducing the risk of heart diseases. Due to their lower caffeine content, they are also providing a more relaxing alternative, help with weight management and support digestive wellness, which further expected to drive the segment growth in the global market.
Tea Market Share, By Packaging, 2025 (%)
| Segments | Shares (%) |
| Cartons/Boxes | 40% |
| Pouches/Sachets | 17% |
| Bottles/Cans (for RTD) | 30% |
| Tin/Metal Containers | 13% |
What Factors Help Cartons/ Boxes Segment to Grow in 2025?
The cartons or boxes segment dominated the market revenue in 2025. Cartons or boxes offer the tea industry advantages such as oxidation, light, and protection from moisture, which maintains the aroma and freshness of tea. They also provide a space saving solution, lightweight and cost-effective solution for transportation and storage, offer an environmentally friendly option and enhance brand identity. Cartons connected with materials such as aluminum foil, preventing the loss of natural flavor and aroma preventing oxidation and create a barrier against moisture and oxygen. These protective layers maintain its quality over time and ensure the tea remains fresh and free from contamination, which further expected to increase the demand for cartons or boxes in the tea industry.
The Bottles/Cans Segment is Expected to Grow Fastest During the Forecast Period
The segment growth in the global market is driven by factors such as the increasing demand for ready-to-drink tea and on-the-go product, increased transport and durability, increased shelf life and rising technological innovations in packaging.
How Supermarkets or Hypermarkets Segment Dominates the Tea Market Revenue in 2025?
The supermarkets and hypermarkets segment dominated the market in 2025. The segment growth in the market is attributed to the factors such as the increasing adoption of advanced technologies, increasing consumer preference towards offline stores, increasing consumer desire to shop offline without waiting for online delivery and increasing consumer trend towards easy shopping experience. To offer quality products to the consumers, supermarkets or hypermarkets are emphasizing addressing new regulatory demands such as quality assurance, convenience, comfort, cost-effectiveness and refrigerant leaks, which further expected accelerate the demand for these distribution channels in the global market.
The Online/E-Commerce Platforms Segment is Expected to Grow Fastest During the Forecast Period
The segment growth in the market is attributed to factors such as the growing e-commerce platform, increasing changing and modern lifestyles, increasing demand for ready-to-drink teas and increasing prevalence of stress related diseases. The significant benefits of shopping for tea online are home delivery, cost-effective, quality status, comfort, and variety. Consumers can find the perfect teas to enjoy at home and at offices, by considering taste and reading reviews, which are further expected to enhance market growth.
End Use Insights
Why did the Household Consumer Segment Dominated the Tea Market in 2025?
Household Consumers dominated the market revenue in 2025, driven by the increasing consumer awareness towards economic health, increasing government initiatives and policies, rise of e-commerce industries, increasing demand for ready-to-drink and convenient tea options and increasing consumer preference towards sustainable, specialty and premium teas.
The Hotels, Restaurants and Cafes are Expected to Grow Fastest During the Forecast Period.
The segment growth in the market is attributed to the growing middle-class population, increasing consumer changing and busy lifestyles, increasing consumer preference towards diverse and premium tea experiences, increasing disposable incomes and growing rapid urbanization.
Government
Wagh Bakri Tea Group
By Product Type
By Form
By Packaging Type
By Distribution Channel
By End-User
By Region

Principal Consultant
Vidyesh Swar, Senior Research Analyst at Towards Food & Beverages, specializes in market research, focusing on supply-demand evaluation, pricing analysis, alternative proteins, plant-based foods, and sustainable food technologies within the industry.
Learn more about Vidyesh Swar
Reviewed By
Aditi Shivarkar, with 14+ years in Food and Beverages market research, specializes in food, beverage, and eco-friendly packaging. She ensures accurate, actionable insights, driving Towards FnB's excellence in industry trends and sustainability.
Learn more about Aditi ShivarkarApril 2026
April 2026
April 2026
April 2026
Tea Market