Revenue, 2024
2.52 Trn
Forecast, 2034
5.44 Trn
CAGR, 2025 - 2034
8%
Report Coverage
Worldwide
Published By
Kesiya Chacko
Reviewed By
Aditi Shivarkar
Reviewed By
Aman Singh
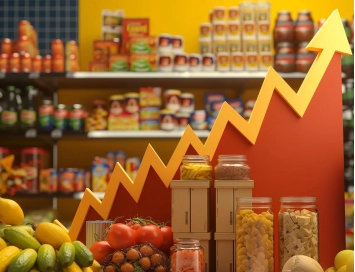
The global halal food and beverage market is expanding rapidly, driven by increasing demand from Muslim consumers who prioritize Halal-certified products that comply with Islamic dietary guidelines. This market is fueled by a growing awareness of health and wellness, with more consumers opting for Halal food choices for ethical, health, and cultural reasons.
Halal Food and Beverage Market Share, By Region, 2024 (%)
| Segments | Share (%) |
| North America | 25% |
| Europe | 25% |
| Asia Pacific | 35% |
| LAMEA | 15% |
- North America - Represents 25% of the market, a large market for halal food, but the growth potential is slightly overshadowed by regions like Asia Pacific, which have a larger consumer base.
- Asia Pacific - The largest market, with 35% of the share, driven by significant Muslim populations and rapid growth in demand for halal-certified products.
- Europe - Accounts for 25% of the market, a strong market, especially in countries with substantial Muslim populations, but still behind Asia Pacific in terms of market size and growth rate.
- LAMEA (Latin America, Middle East, and Africa) - Represents 15% of the market, a smaller market with regional challenges in accessibility and awareness, though growing steadily due to expanding Muslim populations and economic development.
Halal Food and Beverage Market Share, By Product, 2024 (%)
| Segments | Share (%) |
| Meat & Alternatives | 35% |
| Milk & Milk Products | 25% |
| Fruits & Vegetables | 20% |
| Grain Products | 10% |
| Others | 10% |
- Meat & Alternatives - Represents 35% of the market, driven by high demand for halal-certified meat and plant-based alternatives, appealing to both religious and health-conscious consumers.
- Milk & Milk Products - Represents 25% of the market, driven by the popularity of halal-certified dairy products, though overshadowed by the dominant meat and alternatives segment.
- Fruits & Vegetables - Accounts for 20% of the market, with growing demand for halal-certified fresh produce, but remains secondary compared to the protein-focused segments.
- Grain Products - Represents 10% of the market, a smaller segment with niche demand, often driven by regional preferences, but not a primary driver in the overall halal food market.
- Others - Represents 10% of the market, covering various smaller product categories like snacks and processed foods, with limited growth compared to core segments like meat and dairy.
Halal Food and Beverage Market Share, By Distribution Channel, 2024 (%)
| Segments | Share (%) |
| Hypermarket & Supermarket | 40% |
| Departmental Store | 25% |
| Online | 25% |
| Others | 10% |
- Hypermarket & Supermarket - The largest channel, with 40% of the market share, offering a wide product variety and reaching large consumer bases across various regions.
- Departmental Store - Accounts for 25% of the market share, driven by consumer convenience, but remains secondary to hypermarkets and supermarkets in terms of reach and sales volume.
- Online - Represents 25% of the market and is rapidly growing due to the increasing preference for online shopping and the expanding availability of halal food options.
- Others - Represents 10% of the market, a minor segment that includes niche distribution methods, accounting for a small portion of the market with limited reach.
Halal Food and Beverage Market Leading Companies
- Nestle SA
- JBS S.A.
- BRF SA
- Kawan Food Berhad
- Cargill
- Carrefour
- Crescent Foods
- American Halal Company, PBC
- American Foods Group, LLC
- Al islami foods
Segments Covered in the Report
By Product
- Meat & Alternatives
- Milk & Milk Products
- Fruits & Vegetables
- Grain Products
- Others
By Distribution Channel
- Hypermarket & Supermarket
- Departmental Store
- Online
- Others
By Region
- North America
- Asia Pacific
- Europe
- Middle East and Africa
- Latin America
Tables & Figures
By Product 2024 to 2034 (USD Trillion)

| Subsegment | 2024 | 2025 | 2026 | 2027 | 2028 | 2029 | 2030 | 2031 | 2032 | 2033 | 2034 |
|---|---|---|---|---|---|---|---|---|---|---|---|
| Meat & Alternatives | 0.95 | 1.03 | 1.11 | 1.20 | 1.30 | 1.40 | 1.51 | 1.63 | 1.76 | 1.90 | 2.06 |
| Milk & Milk Products | 0.68 | 0.73 | 0.79 | 0.86 | 0.93 | 1.00 | 1.08 | 1.17 | 1.26 | 1.36 | 1.47 |
| Fruits & Vegetables | 0.54 | 0.59 | 0.63 | 0.69 | 0.74 | 0.80 | 0.86 | 0.93 | 1.01 | 1.09 | 1.17 |
| Grain Products | 0.27 | 0.29 | 0.32 | 0.34 | 0.37 | 0.40 | 0.43 | 0.47 | 0.50 | 0.54 | 0.59 |
| Others | 0.27 | 0.29 | 0.32 | 0.34 | 0.37 | 0.40 | 0.43 | 0.47 | 0.50 | 0.54 | 0.59 |
By Distribution Channel 2024 to 2034 (USD Trillion)
| Subsegment | 2024 | 2025 | 2026 | 2027 | 2028 | 2029 | 2030 | 2031 | 2032 | 2033 | 2034 |
|---|---|---|---|---|---|---|---|---|---|---|---|
| Hypermarket & Supermarket | 1.09 | 1.18 | 1.27 | 1.37 | 1.48 | 1.60 | 1.73 | 1.86 | 2.01 | 2.17 | 2.35 |
| Departmental Store | 0.68 | 0.73 | 0.79 | 0.86 | 0.93 | 1.00 | 1.08 | 1.17 | 1.26 | 1.36 | 1.47 |
| Online | 0.68 | 0.73 | 0.79 | 0.86 | 0.93 | 1.00 | 1.08 | 1.17 | 1.26 | 1.36 | 1.47 |
| Others | 0.27 | 0.29 | 0.32 | 0.34 | 0.37 | 0.40 | 0.43 | 0.47 | 0.50 | 0.54 | 0.59 |
By Region 2024 to 2034 (USD Trillion)
| Subsegment | 2024 | 2025 | 2026 | 2027 | 2028 | 2029 | 2030 | 2031 | 2032 | 2033 | 2034 |
|---|---|---|---|---|---|---|---|---|---|---|---|
| North America | 0.68 | 0.73 | 0.79 | 0.86 | 0.93 | 1.00 | 1.08 | 1.17 | 1.26 | 1.36 | 1.47 |
| Asia Pacific | 0.95 | 1.03 | 1.11 | 1.20 | 1.30 | 1.40 | 1.51 | 1.63 | 1.76 | 1.90 | 2.06 |
| Europe | 0.68 | 0.73 | 0.79 | 0.86 | 0.93 | 1.00 | 1.08 | 1.17 | 1.26 | 1.36 | 1.47 |
| LAMEA | 0.41 | 0.44 | 0.48 | 0.51 | 0.56 | 0.60 | 0.65 | 0.70 | 0.76 | 0.82 | 0.88 |
List of Figures & Tables
List of Tables
- Global Halal Food and Beverage Market Size (USD Trillion) by Product, 2024–2034
- Global Halal Food and Beverage Market Size (USD Trillion) by Distribution Channel, 2024–2034
- North America Halal Food and Beverage Market Size (USD Trillion) by Product, 2024–2034
- North America Halal Food and Beverage Market Size (USD Trillion) by Distribution Channel, 2024–2034
- U.S. Halal Food and Beverage Market Size (USD Trillion) by Product, 2024–2034
- Canada Halal Food and Beverage Market Size (USD Trillion) by Product, 2024–2034
- Mexico Halal Food and Beverage Market Size (USD Trillion) by Product, 2024–2034
- Europe Halal Food and Beverage Market Size (USD Trillion) by Product, 2024–2034
- Europe Halal Food and Beverage Market Size (USD Trillion) by Distribution Channel, 2024–2034
- Germany Halal Food and Beverage Market Size (USD Trillion) by Product, 2024–2034
- France Halal Food and Beverage Market Size (USD Trillion) by Product, 2024–2034
- UK Halal Food and Beverage Market Size (USD Trillion) by Product, 2024–2034
- Italy Halal Food and Beverage Market Size (USD Trillion) by Product, 2024–2034
- Asia Pacific Halal Food and Beverage Market Size (USD Trillion) by Product, 2024–2034
- Asia Pacific Halal Food and Beverage Market Size (USD Trillion) by Distribution Channel, 2024–2034
- China Halal Food and Beverage Market Size (USD Trillion) by Product, 2024–2034
- Japan Halal Food and Beverage Market Size (USD Trillion) by Product, 2024–2034
- South Korea Halal Food and Beverage Market Size (USD Trillion) by Product, 2024–2034
- India Halal Food and Beverage Market Size (USD Trillion) by Product, 2024–2034
- Southeast Asia Halal Food and Beverage Market Size (USD Trillion) by Product, 2024–2034
- Latin America Halal Food and Beverage Market Size (USD Trillion) by Product, 2024–2034
- Brazil Halal Food and Beverage Market Size (USD Trillion) by Product, 2024–2034
- Middle East and Africa Halal Food and Beverage Market Size (USD Trillion) by Product, 2024–2034
- Turkey Halal Food and Beverage Market Size (USD Trillion) by Product, 2024–2034
- GCC Countries Halal Food and Beverage Market Size (USD Trillion) by Product, 2024–2034
- Africa Halal Food and Beverage Market Size (USD Trillion) by Product, 2024–2034
List of Figures
- Global Halal Food and Beverage Market Share by Product, 2024–2034
- Global Halal Food and Beverage Market Share by Distribution Channel, 2024–2034
- North America Halal Food and Beverage Market Share by Product, 2024–2034
- North America Halal Food and Beverage Market Share by Distribution Channel, 2024–2034
- U.S. Halal Food and Beverage Market Share by Product, 2024–2034
- Canada Halal Food and Beverage Market Share by Product, 2024–2034
- Mexico Halal Food and Beverage Market Share by Product, 2024–2034
- Europe Halal Food and Beverage Market Share by Product, 2024–2034
- Europe Halal Food and Beverage Market Share by Distribution Channel, 2024–2034
- Germany Halal Food and Beverage Market Share by Product, 2024–2034
- France Halal Food and Beverage Market Share by Product, 2024–2034
- UK Halal Food and Beverage Market Share by Product, 2024–2034
- Italy Halal Food and Beverage Market Share by Product, 2024–2034
- Asia Pacific Halal Food and Beverage Market Share by Product, 2024–2034
- Asia Pacific Halal Food and Beverage Market Share by Distribution Channel, 2024–2034
- China Halal Food and Beverage Market Share by Product, 2024–2034
- Japan Halal Food and Beverage Market Share by Product, 2024–2034
- South Korea Halal Food and Beverage Market Share by Product, 2024–2034
- India Halal Food and Beverage Market Share by Product, 2024–2034
- Southeast Asia Halal Food and Beverage Market Share by Product, 2024–2034
- Latin America Halal Food and Beverage Market Share by Product, 2024–2034
- Brazil Halal Food and Beverage Market Share by Product, 2024–2034
- Middle East and Africa Halal Food and Beverage Market Share by Product, 2024–2034
- Turkey Halal Food and Beverage Market Share by Product, 2024–2034
- GCC Countries Halal Food and Beverage Market Share by Product, 2024–2034
- Africa Halal Food and Beverage Market Share by Product, 2024–2034

Halal Food and Beverage Market Size to Climb USD 2.72 Trillion in 2025
The halal food and beverage market size is projected to reach from USD 2.72 trillion in 2025 to USD 5.44 trillion by 2034 at a CAGR of 8% from 2025 to 2034.
Proceed To Buy
Proceed To CheckoutMake Every Move Strategic. Get Insights, Fully Customized
- On-Demand Metrics & KPIs
- Industry-Specific Dashboards
- Quick Turnaround, No Compromises
Quick Contact
- sales@towardsfnb.com
- NA : +1 804 441 9344
- APAC : +91 9356 9282 04
- EU : +44 7782 560 738